You may have heard about Planetary Boundaries (PB for short) and that we have already crossed a few. What are these boundaries? How many are there? Which ones have we broken already? "But you promised me a doughnut!" you might shout at this point. Hold on, it is coming.
PB were introduced back in 2009 by Johan Rockström then based at the Stockholm Resilience Center. They were subsequently revised in an article published in Science in 2015. Have a look at Johan Rockström talking about his work already more than 10 years ago:
Planetary boundaries and the Earth system
The planetary boundaries framework defines a safe operating space for humanity based on the intrinsic biophysical processes that regulate the stability of the Earth system.
Will Steffen et al. (2015)
The PB framework is an attempt at assessing the risk that humans destabilize the Earth System (ES for short). PB are not thresholds in the sense that crossing one or more of the PB doesn't result in an immediate change to the ES. However they define a safe operating space, within which, according to the current scientific knowledge, there is a very limited risk of perturbation of the ES. Beyond the safe operating space is a zone of uncertainty reflecting the limitations of our current scientific understanding as well as the stochastic behavior of the ES. Operating in this zone is risky as follows from the precautionary principle. Outside of the zone of uncertainty is the danger zone where current scientific knowledge indicates high risks of impacting the ES.
There are nine identified planetary boundaries, of which seven have been measured (in the publication) at the global scale. Some of these boundaries are interconnected, meaning that operating beyond the safe zone of one of the PB might trigger processes that impact other PB. For each measurable PB there is at least one control variable that is measured. Below is a graph showing where we stand with respect to the nine boundaries and an explanation for each of them. Two of them are considered core boundaries as they play a greater role in the regulation of the ES and are connected to the other PB.
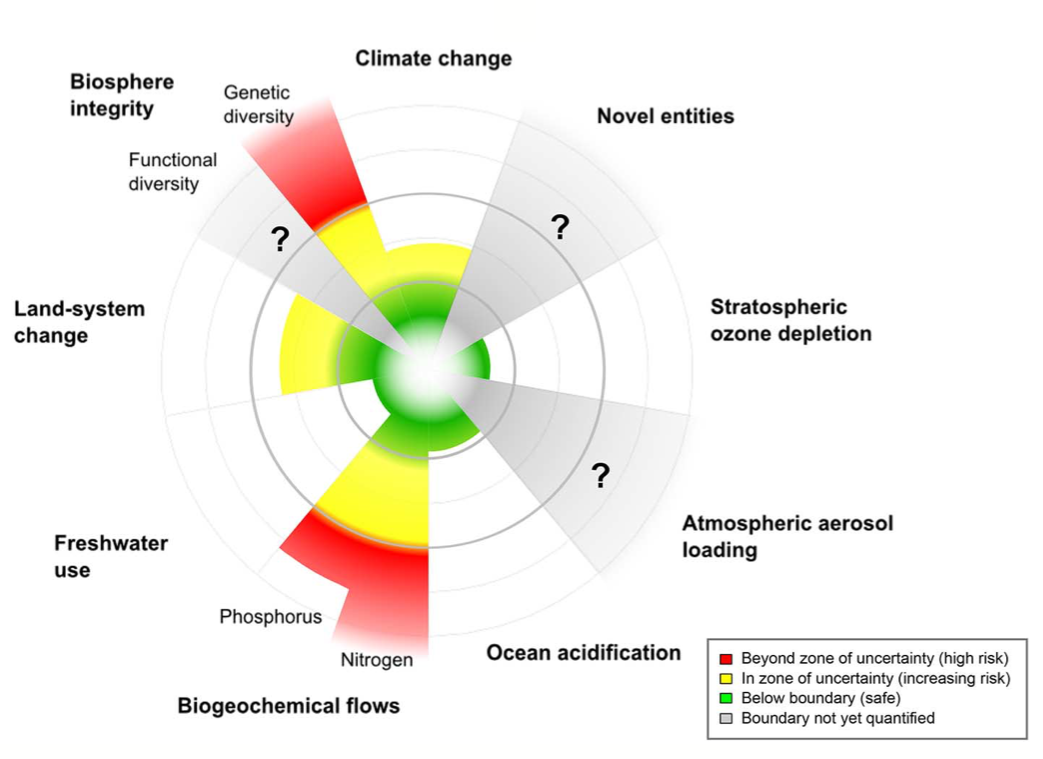
Source: Planetary boundaries: Guiding human development on a changing planet
- Climate change (core boundary): At this point this shouldn't be a surprise, human activity is having an impact on the climate. The atmospheric concentration of
\rm{CO_2}is used as a proxy to measure this impact. As of 2015 it was estimated that the safe zone ended at 350 part per million (ppm) and that the danger zone started at 450 ppm. Have a look at today's concentration. - Biosphere integrity (core boundary): The biosphere integrity is measured by the extinction rate, i.e. the speed at which species disappear. The background rate (the rate without accounting for the human pressure) is estimated to be one extinction per million species-year
\rm{E/MSY}. It means if you would take one million species, you would expect one to go extinct after a year. The end of the safe zone is at 10\rm{E/MSY}, while the beginning of the danger zone is at 100\rm{E/MSY}. The current extinction rate is hard to measure, leading to important uncertainty but according to the article it is between 100 and 1000\rm{E/MSY}. - Stratospheric ozone depletion: Depending on your age, you might have heard of this one as we went pretty far beyond the boundary in the 1980s. resulting in the ozone hole. This is an example of a PB that has been transgressed in the past where proper action brought us back in the safe zone. It corresponds to the concentration of ozone in the stratosphere.
- Ocean acidification: This is tightly linked to the
\rm{CO_2}emissions as part of these emissions are dissolved in the Ocean resulting in its acidification. The main concern is the incapacity of organisms such as plankton and shellfish to develop their shells if the acidity gets to high, impacting in turn all of the food chain. - Biogeochemical flows: We have mentioned the carbon cycle in a previous post, but it turns out that other chemical elements also have their own cycles that can be affected by human activities. In particular, the heavy use of fertilizers in agriculture is impacting the abundance of Phosphorus
\rm{P}and Nitrogen\rm{N}in the environment, having an impact on water ecosystems. - Freshwater use: This is the global maximum amount of water retained from rives, lakes, reservoirs and renewable ground waters stores. There are important regional variations but as of 2015 the global freshwater consumption was estimated at 2600
\rm{km}^3per year. The end of the safe zone is estimated at 4000\rm{km}^3per year and the beginning of the danger zone at 6000\rm{km}^3per year. - Land-system change: The area of forest land as a percentage of the original forest cover. It is linked both to climate change (as the forest is a carbon sink) and to the biosphere integrity (as deforestation reduces the habitat of many species). As of 2015 the global coverage was 62% with a safe zone ending at 75% and a danger zone starting at 54%.
- Atmospheric aerosol loading: Aerosols are particles in suspension in the air. They have a notorious impact on human health (the publication mentions 7.2 million related deaths per year) and can also impact the ES. The quantity of aerosol can be measured locally by looking at the optical depth of the atmosphere, but the publication provides no global average.
- Novel entities: They correspond to new chemicals, engineered materials and engineered organisms that were not previously existing in the ES, together with the anthropogenic rejection of natural elements like heavy metals. Given the complexity of the problem (the article is talking about more than 100,000 commercialized substances, not including nanomaterials and plastic polymers) there is currently no simple control variable to monitor.
As of 2015 we had entered the danger zone for two planetary boundaries: biosphere integrity and biogeochemical flows. We had exited the safe zone for two others: climate change and land-system change.
Here comes your doughnut
Building on the notion of planetary boundaries and adding the notion of social foundation, Kate Raworth came up with the concept of Doughnut Economics. Have a look at her powerful TED talk above. The doughnut economics were first discussed in an Oxfam publication called A safe and just space for humanity. In this article, she gives a definition of sustainable development, which is the end goal of doughnut economics:
Achieving sustainable development means ensuring that all people have the resources needed – such as food, water, health care, and energy – to fulfill their human rights. And it means ensuring that humanity’s use of natural resources does not stress critical Earth-system processes – by causing climate change or biodiversity loss, for example – to the point that Earth is pushed out of the stable state, known as the Holocene, which has been so beneficial to humankind over the past 10,000 years.
Kate Raworth
The social foundation was later refined based on the Sustainable Development Goals (SDG) adopted by the United Nations in 2015. It encompasses 12 needs to fulfill people's economic and social rights:

Source: Doughnut Economics
As depicted on the chart above, the social foundation creates a lower bound in the usage of resources, while the planetary boundaries create an upper bound. In between the two lies what Kate Raworth calls the safe and just space for humanity.
Can we all feed on that doughnut?
The next question becomes: Can we attain the social foundation for all without crossing the planetary boundaries? In other words, does this safe and just space exists? In an article called A good life for all within planetary boundaries published in Nature Sustainability back in 2018 (the article is easily accessible on the web), Daniel O'Neill and his team explore this question.
Their approach consists in looking at the level of individual countries to see how each of them is performing with respect to the social foundation as well as to the PB. The hope is to identify countries that would be close to or within the safe and just space. More than 150 countries are included in their results.
To quantify the PB at the country level, a top down approach is used where PB are down scaled according to the population size. This is a per capita approach of the biophysical boundaries. In this way, they are able to measure four out of the seven quantified PB (remember there are nine PB of which seven have been quantified) for most countries. As they consider the biogeochemical flows for the phosphorus and the nitrogen independently, they obtain five boundaries. On top of these, they add two measurements that are not part of the original PB framework. Here is the final list:
- Climate change (PB)
- Biogeochemical flows - nitrogen (PB)
- Biogeochemical flows - phosphorus (PB)
- Freshwater use (PB)
- Land-system change (PB)
- Ecological footprint: Measuring the amount of land and sea required to produce the resources consumed and to absorb the
\rm{CO_2}emitted by a population. This is a widely used estimator with worldwide data provided by the Global Footprint Network. It is tightly coupled to climate change as it includes the\rm{CO_2}emissions - Material footprint: Measuring the quantity of raw materials such as minerals, fossil fuels and biomass that are used to support the consumption of goods and services by a population. Also coupled to climate change as it includes fossil fuels extraction.
For the social foundation, the article defines and quantifies a list of social thresholds, similar to the doughnut economics ones with slight differences. It includes:
- Life satisfaction: A self reported estimate of quality of life based on the Cantril ladder with data provided by the World Happiness Report. The threshold is set to 6.5 on a scale from 0 to 10.
- Healthy life expectancy: Life expectancy at birth with no major disease or infirmity. The threshold is set to 65 years of life.
- Nutrition: Amount of calories available daily. The threshold is set to 2500
\rm{kcal}per day. - Sanitation: Fraction of the population having access to sanitation facilities. The threshold is set to 95%.
- Income: Fraction of the population above the poverty threshold, taken at $1.90 per day based on the World Bank data estimate. The threshold is set to 95%.
- Access to energy: Fraction of the population with access to electricity. The threshold is set to 95%.
- Education: Fraction of the population attending secondary education. The threshold is set to 95%.
- Social support: Self reported availability of relatives or friends to support in case of need. The threshold is set to 90%.
- Democratic quality: Based on the Worldwide Governance Indicators.
- Equality: Estimation of the income inequalities based on the Gini coefficient.
- Employment: One minus the fraction of the population unemployed. The threshold is set to 94% (or 6% unemployment).
An insightful interactive website allows you to have a look at how your country performs with respect to both the social foundation and the PB. On the graph below, countries are reported as a function of how many boundaries they cross (x-axis) and how many social thresholds they attain (y-axis). For each country, the size of the blue circle indicates the population size. The safe and just space is situated at the top left corner where all the social thresholds are attained but no PB is crossed. As one can see, no country is currently getting close to that space.
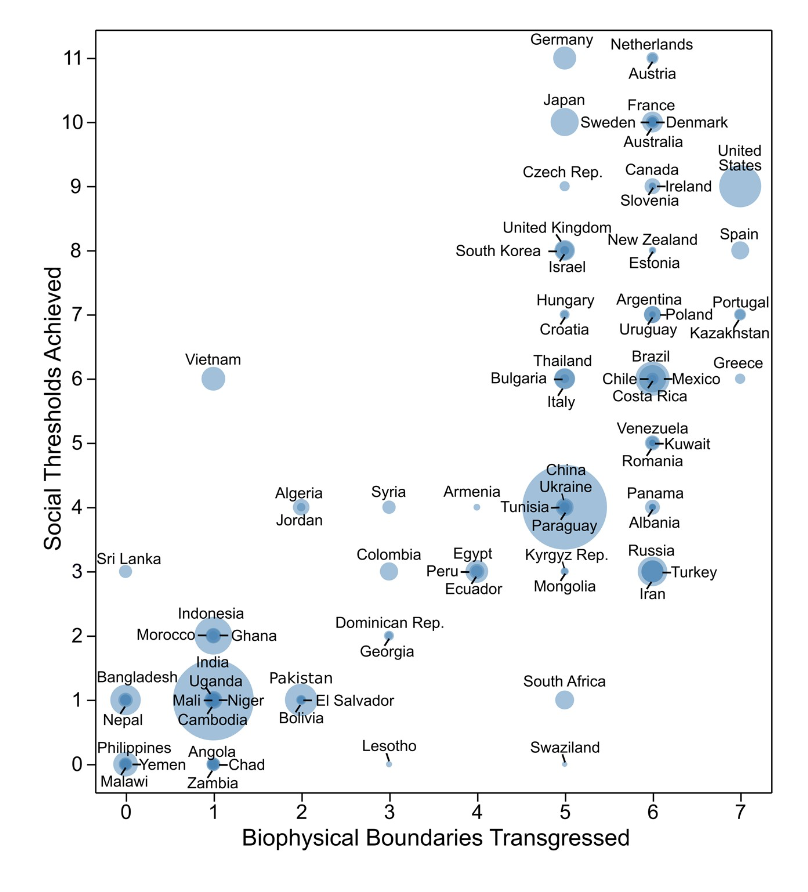
Source: A good life for all within planetary boundaries
The fact that no country today is able to provide the social foundation without breaking five or more boundaries is no good news but is not equivalent to saying that the safe and just space does not exist. It is good to keep in mind that the boundaries as defined in the graph above are not strictly equivalent to the ones of the PB framework. In particular it is likely that if a country performs poorly with respect to climate change, it will perform poorly for the ecological and material footprints. Similarly usage of phosphorus and nitrogen are likely to be correlated as both results mainly from the use of fertilizers. I believe this explains why there is this vertical "cut" with most countries being above five boundaries trespassed.
Focusing on climate change, this last graph shows the correlations between the \rm{CO_2} emissions of a country and the different social needs. Every black dot corresponds to a given country. It is interesting to note that there is no correlation between the \rm{CO_2} emissions of a country and its employment rate (bottom-middle graph). This indicates that unemployment shouldn't be used as an argument neither for or against the lowering of the carbon intensity of the economy.
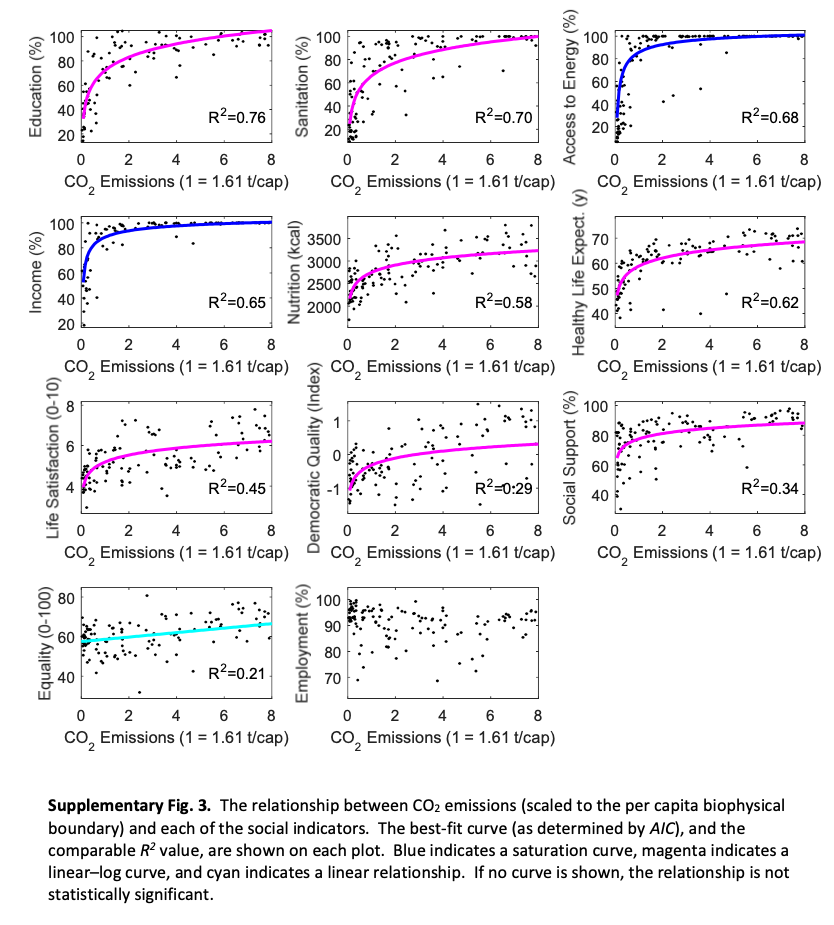
Source: A good life for all within planetary boundaries
We can see that in many cases the relations are not linear, and that some countries are able to achieve the social need thresholds (and above) with little \rm{CO_2} emissions. The challenge is of course to meet all needs while staying below the PB. Thus the remaining question is: Have the different countries sample all of the parameter space? If not, we can still explore in search for the safe and just space for humanity. Closing up with a quote from the publication:
If all people are to lead a good life within planetary boundaries, then our results suggest that provisioning systems must be fundamentally restructured to enable basic needs to be met at a much lower level of resource use.
Daniel O'Neill et al. (2018)


