Have you ever wondered how do we know how much \rm{CO_2}we are emitting globally? And where is this \rm{CO_2} going to? For sure I did. It turns out that a global organization called the Global Carbon Project set this goal to itself back in 2001. In their own words:
The scientific goal of the Global Carbon Project is to develop a complete picture of the global carbon cycle, including both its biophysical and human dimensions together with the interactions and feedback between them.
Since 2005 they have been providing a report on what they call the "Global Carbon Budget" almost every year. And they release the report under the Creative Common license! 🙂 So I have had a look at their last report: Global Carbon Budget 2020.
Carbon Emissions
The carbon budget tracks the anthropogenic (read human made) emissions of \rm{CO_2}. They are divided into two categories:
E_{\rm{fos}}: emissions resulting from the combustion and oxidation of fossil fuels from all energy and industrial processes (including cement production and carbonation). It includes emissions from a wide range of activities like transport, heating and cooling, industry, the production and carbonation of cement and other process emissions like the production of chemicals and fertilizers. Its measurement is essentially based on energy consumption data.E_{\rm{luc}}: emissions resulting from deliberate human activities on land, including land-use change. It is the net emissions (sum of emissions and removals) due to all anthropogenic activities such as deforestation, afforestation, logging, forest degradation, shifting cultivation. It is estimated by so-called bookkeeping models keeping track of human activities, such as turning forest to crops, around the world.
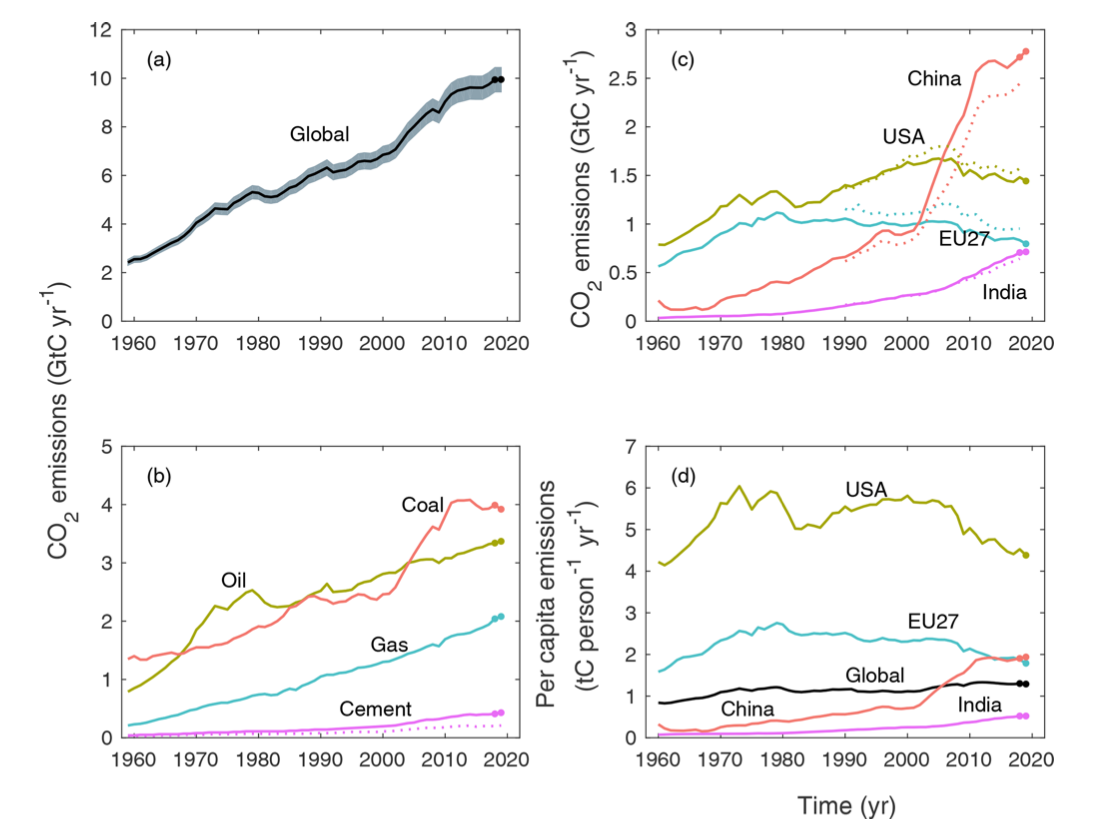
Both terms are measured in giga-tons of carbon per year (GtCyr^{-1}), a giga-ton being 10^{12}kilograms. The graph below, taken from the publication shows the global fossil emissions (a), together with breakdowns of the emissions per categories (b), for selected regions (c), and for selected regions per capita (d). We see that the global emissions from fossil fuels are still rising as of 2020 despite a slow decrease in the EU27 and the USA. The emissions per capita allow to put into perspective the impressive increase in emissions of China. Yes China is now and by far the country using the most fossil fuels, but looking per capita the emissions just recently reached the level of EU and are still twice below the USA.
Carbon Sinks
Where are all these emissions going? The different reservoirs the emissions go to are called sinks. There is an active carbon cycle that circulates carbon from different sinks: the atmosphere, the ocean, the terrestrial biosphere and geologic reservoirs. Exchanges between the 3 firsts occur on time scale ranging from hours to millennia. Geologic reservoirs like oil fields are formed on geological time scales and are not considered in the carbon budget (although the action of emptying these reservoirs is taken into account by E_{\rm{fos}}). Lets have a look at the 3 main sinks:
- As you might have guessed a fair fraction is going to the atmosphere. The Global Monitoring Laboratory part of the National Oceanic and Atmospheric Administration of the USA measures the
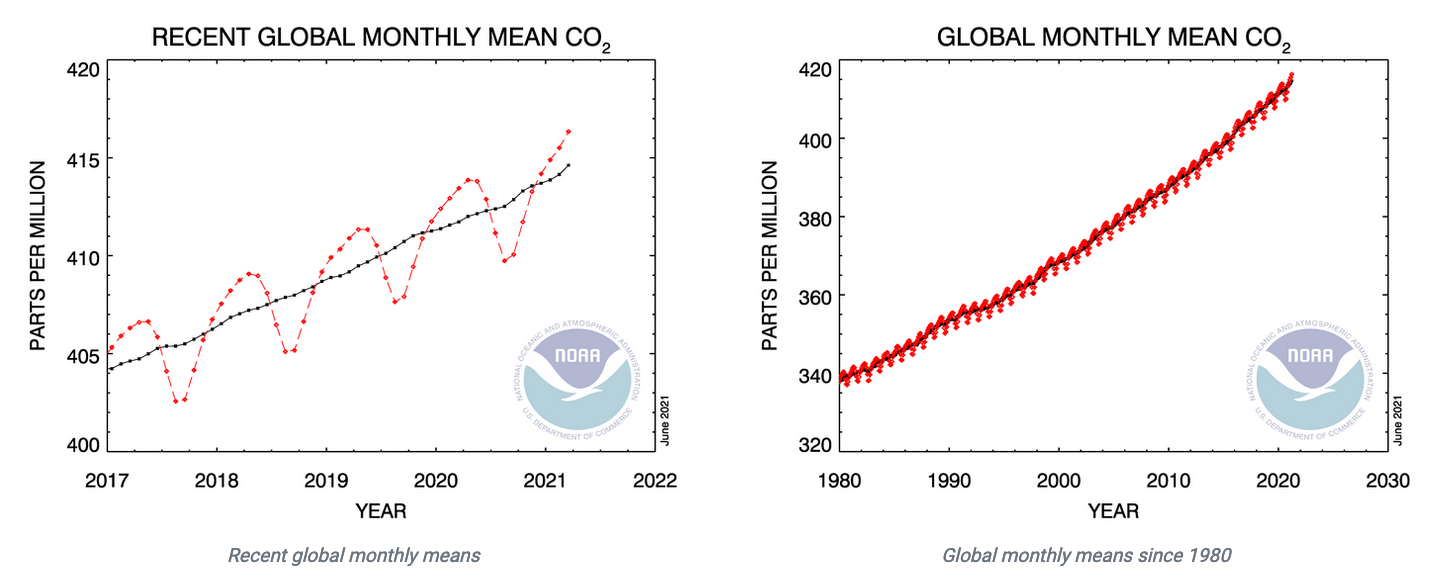
\rm{CO_2}concentration of the atmosphere in part per million (ppm) since 1958. Daily measurements are available on there website. At the time of writing these lines, the last measurement available was for June 19th at 414.94 ppm (It was 277ppm in 1750). The graph below, taken from their website, shows the evolution of the\rm{CO_2}concentration of the atmosphere. The upward trend results from human activity while the seasonality is due to the vegetation: growing plants absorb\rm{CO_2}from the atmosphere via photosynthesis,\rm{CO_2}that is then re-emitted as the plants (or their leaves) die. Because of the Northern hemisphere having more lands, and thus more vegetation coverage than the Southern hemisphere, photosynthesis removes more\rm{CO_2}from the atmosphere during boreal Summer than austral Summer. This "breathing cycle" of the Earth was beautifully put into a visualization by Nadieh Bremer. But lets get back to our carbon budget. From the direct measurements we can derive the growth rate of the atmospheric\rm{CO_2}concentrationG_{\rm{atm}}, that is the amount of\rm{CO_2}that has been added to the atmosphere in a year.

- Although we don't put much
\rm{CO_2}directly in the ocean (or do we?), the ocean is in contact with the atmosphere. When the concentration of\rm{CO_2}in the atmosphere grows, some of the\rm{CO_2}dissolves in the ocean (reaching a so-called phase equilibrium). The reverse is also true, meaning that if we were to remove some of the\rm{CO_2}from the atmosphere, some of the\rm{CO_2}dissolved into the ocean would evaporate into the atmosphere... The yearly amount of\rm{CO_2}dissolved into the ocean is notedS_{\rm{ocean}}. Measurements are not direct but based on models that are constrained by observations. - The last sink is the terrestrial one. It results from an increase in plant growth due to a higher
\rm{CO_2}atmospheric concentration and the lengthening of the growing season due to climate change. It is notedS_{\rm{land}}. It is different fromE_{\rm{luc}}as it does not include direct human land usage. Its measurement is also model based.
Global Carbon Budget
The global carbon budget equation equalizes the anthropogenic emissions to the sinks:
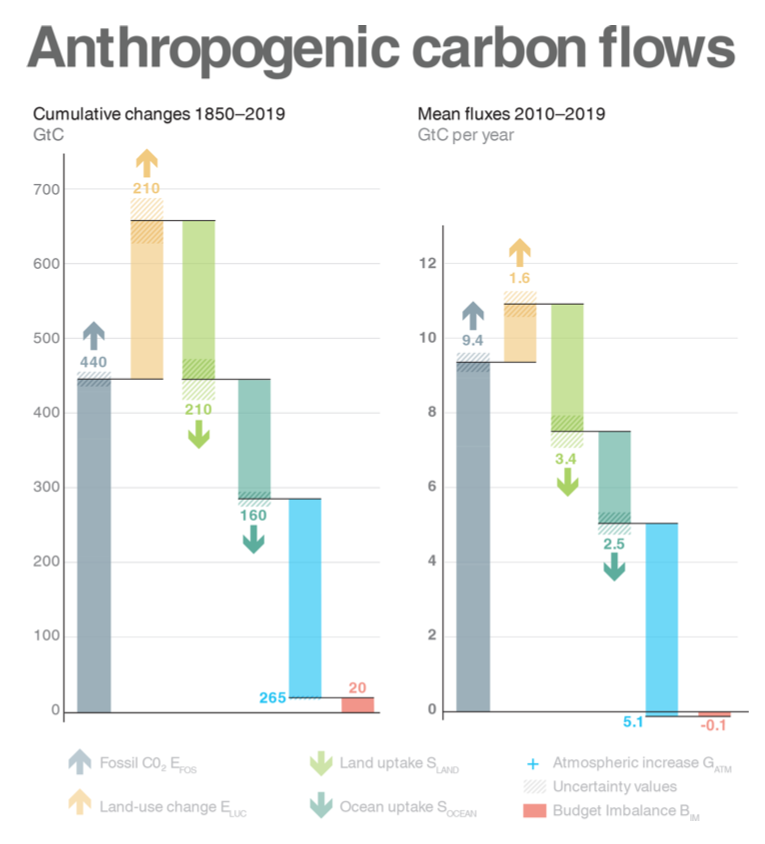
E_{\rm{fos}} + E_{\rm{luc}} = G_{\rm{atm}} + S_{\rm{ocean}} + S_{\rm{land}} + B_{\rm{im}}You may have notice that a new term, B_{\rm{im}}, appeared. In reality global emissions are fully partitioned between the atmosphere, the ocean and the land. In practice, because all terms in the equation are measured with an uncertainty, the reported numbers do not add up to zero. The resulting sum is coined the budget imbalance B_{\rm{im}}. The graph below, taken from the Global Carbon Budget 2020 publication, shows the emissions and their distribution among the different sinks. It shows the cumulative changes in giga-tons of carbon (GtC) since 1850, as well as mean fluxes in giga-tons of carbon per year (GtCyr^{-1}) between 2010 and 2019.
We see that in both cases the budget imbalance is small, indicating that the overall budget is consistent. Since 2010, 85% of anthropogenic \rm{CO_2}emissions are due to fossil fuel usage while the remaining 15% belong to land usage. About 46% of the \rm{CO_2}is going to the atmosphere while around 31% is going into the terrestrial biosphere sink and 23% to the ocean sink.


